Thank you for visiting our site. We have been a trusted and expert coffee authority for over five years. The support of our readers and members sustains our site. Should you purchase products from retailers through links or adverts on our site, we may earn commissions at no additional cost to you. As an Amazon Associate, we earn from qualifying purchases made on Amazon. These commissions are vital in maintaining the operation of our site. We curate some content and strive to provide valuable links to some of the best places on the internet. Please read our disclaimers policy for more information. We trust you will enjoy our site!
Have you mastered the art of brewing the perfect cup of drip coffee? Think again! A recent study has just turned the coffee world upside down, challenging what we thought we knew about the role of brewing temperature in drip coffee.
The secret to a delicious cup of coffee might not lie in the heat of your brew after all. This groundbreaking research suggests that the temperature of your brewing water may not be as crucial to the taste of your coffee as previously believed.
This revelation could revolutionize how we make coffee, with potential benefits ranging from improved consumer safety to enhanced environmental sustainability. So, grab your favorite mug and settle in as we spill the beans on this new research!
The Scientific Study On The Effects of Brewing Temperature
The scientific research study titled “Brew temperature, at fixed brew strength and extraction, has little impact on the sensory profile of drip brew coffee” by Mackenzie E. Batali is a scientific report that investigates the sensory differences in hot-brewed drip coffee prepared at different brew temperatures. The study aimed to understand how brewing variables impact the sensory quality of coffee.
Why Was The Scientific Study Performed?
The study was performed to understand how brewing variables impact coffee’s sensory quality, specifically the brewing water’s temperature.
This is important because the brewing process is a critical step in determining the final quality of the coffee. Yet, there is a lack of scientific understanding about how different brewing parameters affect the sensory profile of coffee.
The researchers aimed to challenge the widely held belief in the coffee industry that the temperature of the brewing water is a crucial determinant of coffee quality.
Current industry guidelines, for example, require home brewers to maintain their temperature at 92–96 °C for certification.
However, the researchers hypothesized that the brew temperature might have a minimal impact on the sensory properties of the coffee when other factors are controlled.
By conducting this study, the researchers hoped to provide empirical evidence to support or refute this hypothesis. The findings could significantly affect industry practices, consumer safety, and environmental sustainability.
For instance, if the brew temperature has a minimal impact on coffee quality, it might be possible to brew coffee at lower temperatures, reducing the risk of scald burns for consumers and decreasing the energy usage in the coffee supply chain, contributing to environmental sustainability.
How Was The Study Performed?
Three separate brew temperatures of 87 °C, 90 °C, or 93 °C were tested, adjusting the grind size and overall brew time as necessary to achieve the target TDS and PE.
The study used a group of twelve panelists (four men and eight women) between 19 and 30. The panelists were selected and trained on all samples thrice weekly for four weeks. They used the Coffee Taster’s Flavor Wheel for reference and were asked to generate descriptors of the sensory attributes of a training set of coffees. Commonly generated terms were put on an unstructured line scale to create the ballot, generally ordered based on common categories on the Coffee Taster’s Flavor Wheel.
The panel was asked first to smell the coffee and evaluate aromas before tasting and evaluating all attributes’ basic tastes, flavor by mouth, and mouthfeel (see later). Three aromas, 22 flavors, two mouthfeels, and four basic tastes were evaluated.
Samples were served in a blind randomized Williams Latin Square block design, with 3-digit blinding codes generated from Red Jade to prevent sample recognition and minimize sensory fatigue. Participants were seated in isolated, positive-pressure, red-lit sensory booths. One to five participants were served per session, each receiving approximately 40 g of each coffee cooled to between 64–66 °C in 200 mL white ceramic mugs before serving.
This temperature was chosen to allow for the sufficient perception of aroma volatiles before drinking while affording a comfortably warm consumption temperature. Panelists were instructed first to evaluate the aroma of the hot coffee and then to evaluate flavor by mouth, taste, and mouthfeel. Panelists recorded attributes via an iPad logged in to Red Jade, with a 15-cm unstructured line scale for each specific sensory attribute from “low” to “high.”
Participants tasted one coffee sample at a time. They evaluated six samples in a 1-h session, starting with a refresher of the sensory references and then evaluating samples at their own pace, rinsing their mouths with water and unsalted saltine crackers in 3-min breaks between samples. The descriptive analysis took 14 sessions, over which all samples were blind-tasted in triplicate.
The scientists used appropriate statistical tests of significance to determine which factors contributed to the taste and flavor of coffee.
Let’s examine some methods, materials, and terms in more detail.
What is a blind randomized Williams Latin Square Block Design?
The blind randomized Williams Latin Square block design is an experimental method to ensure that each sample is tested in each position an equal number of times and that the order in which samples are tested does not affect the results. “Blind” means that the panelists (the people who were testing the sensory profile of the coffee) did not know which sample they were testing to avoid any bias.
What is Red Jade Software:
Red Jade is the software used in the study. Red Jade is a sensory analysis software used in the food and beverage industry. It provides tools for designing and managing sensory and consumer research. The software can collect, analyze, and interpret data from sensory evaluation panels. These panels are typically made up of trained individuals who use their senses (taste, smell, touch, etc.) to evaluate products.
A 3-digit code was randomly generated for each coffee sample. These codes were used to label the samples instead of using their real names or any identifiable information. This is another measure to ensure the panelists didn’t know which sample they were testing.
They used the codes and the blind testing method to prevent the panelists from recognizing the samples. If they knew which sample they were testing, they might have preconceived ideas about it, which could bias the results.
What is Sensory Fatigue?
Sensory fatigue refers to the decreased ability to taste or smell when these senses are used continuously. By randomizing the order of the samples, the study aimed to prevent the panelists from getting used to specific tastes or smells, which could also bias the results.
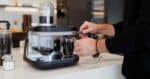
What Drip Coffee Brewing Machine Was Used?
The study used a Curtis G4 Single 1.0 Gal drip brewer (Model: G4TP2S63A3100, Wilbur Curtis Co., Montebello, CA, USA) to brew all the coffee samples.
These brewers were equipped with a flat-bottomed brew basket and disposable paper filters. The choice of this particular brewer was due to its programmability, allowing for a wide range of flow rates and brew temperatures.


The reasons for using a commercial drip brewer could be:
- Standardization: Commercial drip brewers are widely used and provide a standard method of brewing coffee. This makes the results of the study more applicable to real-world conditions.
- Control over variables: Drip brewers allow for control over several brewing variables such as brew time, flow rate, dose (i.e., amount of ground coffee), and grind size. This study systematically varied these variables to control extraction at different brew temperatures.
- Replicability: Using a common brewing method like a commercial drip brewer makes the analysis more replicable. Other researchers can use similar equipment to verify the results.
- Relevance to consumers and industry: Since many people use drip brewers at home or in commercial settings, the study’s findings directly relate to many coffee consumers and professionals.
- Large consistent volume of coffee: The commercial brewer is large, with a volume of 1 gallon.
Why Were Chemicals Added to Water?
The researchers added chemical compounds (CaSO4·2H2O, MgSO4, NaHCO3, and KHCO3) to prepare the brewing water. But why were these chemicals added? Here’s why:
- CaSO4·2H2O, (Calcium sulfate dihydrate or gypsum) and MgSO4 (Magnesium sulfate or Epsom salt) are sources of calcium and magnesium ions. These ions can enhance the extraction of flavor compounds from coffee during brewing. They are critical in determining the water hardness, which can affect the extraction of the coffee flavors and aromas.
- NaHCO3 (Sodium bicarbonate or baking soda) and KHCO3 (Potassium bicarbonate) are sources of bicarbonate ions. Bicarbonate acts as a buffer to maintain the water’s pH, which can impact coffee flavor. A stable pH near 7 is optimal for coffee brewing, as it helps extract desirable flavors and reduce the extraction of undesirable acidic or bitter compounds.
These chemical components are used to achieve the desired mineral content and pH for brewing coffee.
The goal is to create a reproducible water composition that will consistently extract coffee flavors, aromas, and other chemical constituents.
This is particularly important in research and professional settings where consistency and control over variables are key.
What Coffee Was Used in the Research Study?
The Coffea arabica varietals used were Bourbon, Catuai, Caturra, Lempira, Ihcafe 90, Pacas, and Typica from Marcala, La Paz, Honduras, provided by Royal Coffee in Oakland, CA.

The green coffee was mixed and then roasted in a Loring S35 Kestral in 29 kg batches for a total roast time of 11 minutes and 29 seconds, with the first crack recorded at 9 minutes.
Roasting was performed in the same day, and batches were combined and mixed post-roasting to control for any variation.
One week after roasting, coffees were packaged in 1 kg bags, vacuum sealed, and stored in a -20 °C freezer. Bags were defrosted overnight before use.
What is meant by Sensory Profile?
In this study, “sensory profile” refers to the sensory attributes or characteristics describing the coffee samples. These attributes can include taste, smell, texture, and temperature.
The sensory profile is determined by trained panelists who evaluate the coffee samples. They use their senses to assess various aspects of the coffee, such as its aroma, flavor, bitterness, sweetness, and mouthfeel. Each of these aspects contributes to the overall sensory profile of the coffee.
In other words, the sensory profile is a detailed description of the sensory experience of consuming coffee, as evaluated by the trained panelists. It provides a comprehensive understanding of the coffee’s sensory qualities, which can be used to compare different coffee samples or to understand how changes in brewing methods affect the sensory experience of drinking coffee.
What Were the Attributes of the Sensory Profile?
Trained panelists evaluated the following attributes to create a comprehensive sensory profile of each coffee sample.
| Sensory Attribute | Type | Reference Standard |
|---|---|---|
| Aroma | Floral | Dried Celestial Seasonings chamomile tea |
| Aroma | Green/Vegetative | Cut fresh cucumber and snap peas, green beans |
| Aroma | Nutty | Hazelnut oil |
| Taste | Bitter | 0.1% caffeine solution |
| Taste | Salty | 0.15% Iodized salt solution |
| Taste | Sour | 1.25% citric acid solution |
| Taste | Sweet | 2% sucrose solution |
| Flavor | Ashy | Spent Camel cigarette ash |
| Flavor | Berry | Mixed frozen berries defrosted |
| Flavor | Black pepper | Ground black pepper |
| Flavor | Black tea | Lipton brewed black tea |
| Flavor | Brothy | 1 tsp Better than Bouillion vegetable stock in hot water |
| Flavor | Brown roast | Starbucks French roast coffee |
| Flavor | Brown spice | Equal parts dried ground cinnamon, nutmeg, cloves |
| Flavor | Brown sugar | Signature Select light brown sugar |
| Flavor | Cereal | Unsweetened Chex breakfast cereal |
| Flavor | Citrus | Sliced lemon and grapefruit |
| Flavor | Dark chocolate | Hershey’s Cocoa Powder, 90% Ghirardelli dark chocolate |
| Flavor | Dark green | Green Giant cut green beans |
| Flavor | Dried fruit | Sunsweet dried prune and prune juice |
| Flavor | Earthy | Wet potting soil |
| Flavor | Fermented | GT’s Enlightened Organic Raw Unflavored Kombucha |
| Flavor | Fresh green | Cut fresh cucumber and snap peas |
| Flavor | Fruity | Tree Top Applesauce |
| Flavor | Molasses | Grandma’s Original Molasses |
| Flavor | Nutty | Equal parts raw hazelnut, almond, walnut, and cashew, well mixed |
| Flavor | Papery/musty | Damp cardboard |
| Flavor | Rubber | Rubber band, pencil eraser |
| Flavor | Smoky | Wright’s liquid smoke |
| Flavor | Tobacco | Camel cigarette tobacco |
| Flavor | Woody | Wood chips, cedar ball |
| Mouthfeel | Astringent | 2% Alum solution |
| Mouthfeel | Viscous | 5% starch solution |
The data for the table is taken from Batali et.al. 2020. The reference standard is the reference aroma or taste or mouthfeel used to train the people who tasted the coffee.
Brew Temperature did not affect the taste of drip coffee
Three separate brew temperatures of 87 °C, 90 °C, or 93 °C were tested, adjusting the grind size and overall brew time as necessary to achieve the target TDS and PE.
The big message of this scientific study was that they found that the temperature of the brewing water has a minimal impact on the sensory properties of the coffee when other factors like grind size, brew ratio, and flow rate are controlled.
This was a surprising result as it challenged the widely held belief in the coffee industry that the temperature of the brewing water is a crucial determinant of coffee quality.
The study also found that specific sensory attributes of the coffee were affected by the total dissolved solids (TDS) and percent extraction (PE). For instance, sour taste, citrus, dark green, smoky, brown spice, and fermented flavors increased with TDS but decreased with PE. Brown roast and ashy flavors generally increased towards high TDS and high PE. Black tea flavor peaked in intensity at low TDS and high PE.
These findings suggest that a complex interplay of brewing variables influences the sensory profile of coffee and that the brew temperature might not be as critical as currently believed. This could significantly affect industry practices, consumer safety, and environmental sustainability.
What Chemicals Affect The Coffee Taste?
In a previous post, we explored the chemicals responsible for the taste and flavor of coffee.
In this scientific study, the researchers did not conduct a chemical analysis of the coffee. Instead, they referenced previous research to gain insights into the flavors of the coffee used in the study.
The flavors of bitterness and astringency in coffee might be linked to chlorogenic acids.
The term “Viscous” is expected to have a direct relationship with Total Dissolved Solids (TDS), as it describes the thickness and texture of the coffee. Therefore, coffee with more dissolved solids should feel thicker.
The flavors described as Rubber and Earthy could be associated with sulfur-containing compounds, such as thiophenes and thiazoles.
The differences in Rubber and Earthy flavors were minimal, possibly because the coffee used in the study was Coffea arabica. This type of coffee has a lower concentration of thiophenes and thiazoles compared to Coffea canephora (Robusta).
Certain flavors increased with Total Dissolved Solids (TDS) but decreased with Percent Extraction (PE). These flavors include Sour, Citrus, Dark Green, Smoky, Brown Spice, and Fermented.
The Sour flavor showed the most significant change among all tastes measured, with a 20-point difference in average intensity between high TDS, low PE, and low TDS, high PE.
The observed patterns might be due to the relatively quick extraction of organic acids in coffee, such as acetic acid, quinic acid, malic acid, and others. These acids are highly soluble and quickly infuse into brewed coffee.
Some flavors that follow the same pattern, such as Citrus and Fermented, might be linked to specific acids (e.g., citric acid and acetic acid, respectively).
The Fermented flavor might reflect the panelists’ perception of acetic acid, which is associated with vinegar and found in high concentrations in kombucha, the chosen sensory standard for this study. However, further chemical characterization would be necessary to confirm this.
Berry might also be a flavor associated with sourness, considering the sensory standard used in this study (unsweetened fresh mixed berries) is typically regarded as tart/sour and high in malic and citric acids.
The decrease in these flavors with PE is likely due to other flavors that continue to increase in intensity due to slower extraction times, such as bitter compounds. The PE likely alters the relative ratio of bitter compounds to acids and, thus, the perceived taste.
Problems With The Coffee Brewing Control Chart
The study also highlights the work of a researcher named Lockhart in 1957, who established two key metrics for evaluating the quality of brewed coffee:
“Brew strength” is the mass fraction of soluble solids in the brew (also known as total dissolved solids or TDS).
“Extraction yield” is the mass fraction of soluble solids removed from the coffee grounds (also referred to as the percent extraction or PE).
These metrics are related to the brew ratio of water to coffee grounds. Lockhart combined them into the “Coffee Brewing Control Chart,” which is still used as a training tool in the coffee industry.

The chart is divided into nine regions, with boundaries for TDS labeled as “strong” or “weak” and for PE as “bitter” or “underdeveloped.” The central region of the chart, spanning TDS values of 1.15–1.35% and PE values of 18–22%, is denoted as “ideal” and aligns with the Specialty Coffee Association’s “Golden Cup Standard.”
The study points out some issues with the Coffee Brewing Control Chart.
In particular, the chart mixes up terms describing coffee quality (“ideal”), intensity (“weak” or “strong”), and taste profiles (“bitter”). It’s unclear which coffee drinkers prefer the “ideal” coffee, as outlined in the chart’s middle section. Furthermore, the chart doesn’t consider the wide range of flavors and aromas that coffee can offer.
Conclusion: Why Was This Study Important?
This study is significant for several reasons:
Understanding the Impact of Brew Temperature
The study provides empirical evidence about the effect of brew temperature on the sensory profile of drip brew coffee. It challenges the widely held belief that brew temperature is a crucial determinant of coffee quality. The findings suggest that brew temperature has minimal impact on the sensory properties of coffee when other factors like grind size, brew ratio, and flow rate are controlled.
Implications for Coffee Industry Standards
The study suggests that current industry guidelines on brew temperature might be misplaced. For instance, home brewers fail certification if they maintain their temperature at 92–96 °C. However, the study found no significant difference in sensory quality between coffees brewed at temperatures as low as 87 °C and those brewed at 93 °C, provided other factors were controlled.
Consumer Safety and Environmental Sustainability
The study discusses the potential benefits of lower brewing temperature, including increased consumer safety (due to lower risk of scald burns) and environmental sustainability (since heating water represents a significant fraction of the overall energy usage in the coffee supply chain).
Informing Future Research
The study suggests that further investigation is needed to understand how TDS and PE impact sensory quality in different brewing methods, such as full immersion and espresso. This could guide future research in the field.
Overall, the study contributes valuable insights to understanding coffee brewing and could have significant implications for industry practices, consumer safety, and environmental sustainability.
Similar Posts On This Website
Coffee’s Secret Beauty Weapon: The Benefits of Using Coffee in Cosmetics
What Gives Coffee Its Flavor? The Effects of Coffee Chemicals
What Gives Coffee Its Flavor? The Effects of Coffee Chemicals.
2 Good Reasons For Adding Salt to Coffee
How To Make Good Coffee With Science and Mathematics
Amazon and the Amazon logo are trademarks of Amazon.com, Inc, or its affiliates.